I have been experimenting with FastAPI recently, a Python API framework self-describing as "high performance, easy to learn, fast to code, ready for production".
One of the features I wanted my project to have is to be fully asynchronous, from the app server to the SQL requests. As the API is mostly I/O bound, this would allow it to handle many concurrent requests with a single server process, instead of starting a thread per request, as one commony seen with Flask/Gunicorn.
However, this poses a challenge when it comes to profiling the code and interpreting the results.
The limitations of cProfile when profiling asynchronous code
For example, the following graph representation was generated from a cProfile profile recording 300 consecutive calls to a single API endpoint, with an associated get_character handler.

Zooming in, we notice 2 things about the get_character span:
- its
ncallsvalue is 9605, when we really called it 300 times - it is free-floating, completely unlinked from any other span
As an asynchronous function is "entered" and "exited" by the event loop at each await clause, every time the event-loop re-enters a function, cProfile will see this as an additional call, thus causing seemingly larger-than-normal ncalls numbers. Indeed, we await every-time we perform an SQL request, commit or refresh the SQLAlchemy session, or anything else inducing asynchronous I/O.
Secondly, the reason that the get_character span appears to be free-floating is because it is executed outside of the main thread, by the Python event-loop.
This means that our good old faithful cProfile might not cut it for this inherently asynchronous server, and we need a more modern profiler with builtin asynchronous support if we want to really make sense of where time is spent during a request.
Enter pyinstrument!
pyinstrument is a statistical profiler, contrary to cProfile, which is deterministic.
Deterministic profiling is meant to reflect the fact that all function call, function return, and exception events are monitored, and precise timings are made for the intervals between these events (during which time the user’s code is executing). In contrast, statistical profiling [...] randomly samples the effective instruction pointer, and deduces where time is being spent. The latter technique traditionally involves less overhead (as the code does not need to be instrumented), but provides only relative indications of where time is being spent.
Second, it advertises native support for profiling asynchronous python code:
pyinstrumentcan profile async programs that useasyncandawait. This async support works by tracking the context of execution, as provided by the built-incontextvarsmodule.When you start a
Profilerwith theasync_modeenabled or strict (not disabled), thatProfileris attached to the current async context.When profiling,
pyinstrumentkeeps an eye on the context. When execution exits the context, it captures the await stack that caused the context to exit. Any time spent outside the context is attributed to the that halted execution of the await.
This should allow us to get a sensible picture of where time is spent during the lifespan of a FastAPI request, while also skipping the spans that are too fast to be profiled.
Integrating pyinstrument with FastAPI
We rely on the FastAPI.middleware decorator to register a profiling middleware (only enabled if the PROFILING_ENABLED setting it set to True) in charge of profiling a request if the profile=true query argument is passed by the client.
By default, this middleware will generate a JSON report compatible with Speedscope, an online interactive flamegraph visualizer. However, if the profile_format=html query argument is passed, then a simple HTML report will be dumped to disk instead.
from fastapi import Request
from pyinstrument import Profiler
from pyinstrument.renderers.html import HTMLRenderer
from pyinstrument.renderers.speedscope import SpeedscopeRenderer


def register_middlewares(app: FastAPI):
    ...
    if app.settings.PROFILING_ENABLED is True:

        @app.middleware("http")
        async def profile_request(request: Request, call_next: Callable):
            """Profile the current request

            Taken from https://pyinstrument.readthedocs.io/en/latest/guide.html#profile-a-web-request-in-fastapi
            with small improvements.

            """
            # we map a profile type to a file extension, as well as a pyinstrument profile renderer
            profile_type_to_ext = {"html": "html", "speedscope": "speedscope.json"}
            profile_type_to_renderer = {
                "html": HTMLRenderer,
                "speedscope": SpeedscopeRenderer,
            }

            # if the `profile=true` HTTP query argument is passed, we profile the request
            if request.query_params.get("profile", False):

                # The default profile format is speedscope
                profile_type = request.query_params.get("profile_format", "speedscope")

                # we profile the request along with all additional middlewares, by interrupting
                # the program every 1ms1 and records the entire stack at that point
                with Profiler(interval=0.001, async_mode="enabled") as profiler:
                    response = await call_next(request)

                # we dump the profiling into a file
                extension = profile_type_to_ext[profile_type]
                renderer = profile_type_to_renderer[profile_type]()
                with open(f"profile.{extension}", "w") as out:
                    out.write(profiler.output(renderer=renderer))
                return response

            # Proceed without profiling
            return await call_next(request)
You can browse the project code to see how the middleware is wired into the application itself
Let's see the results
HTML profile
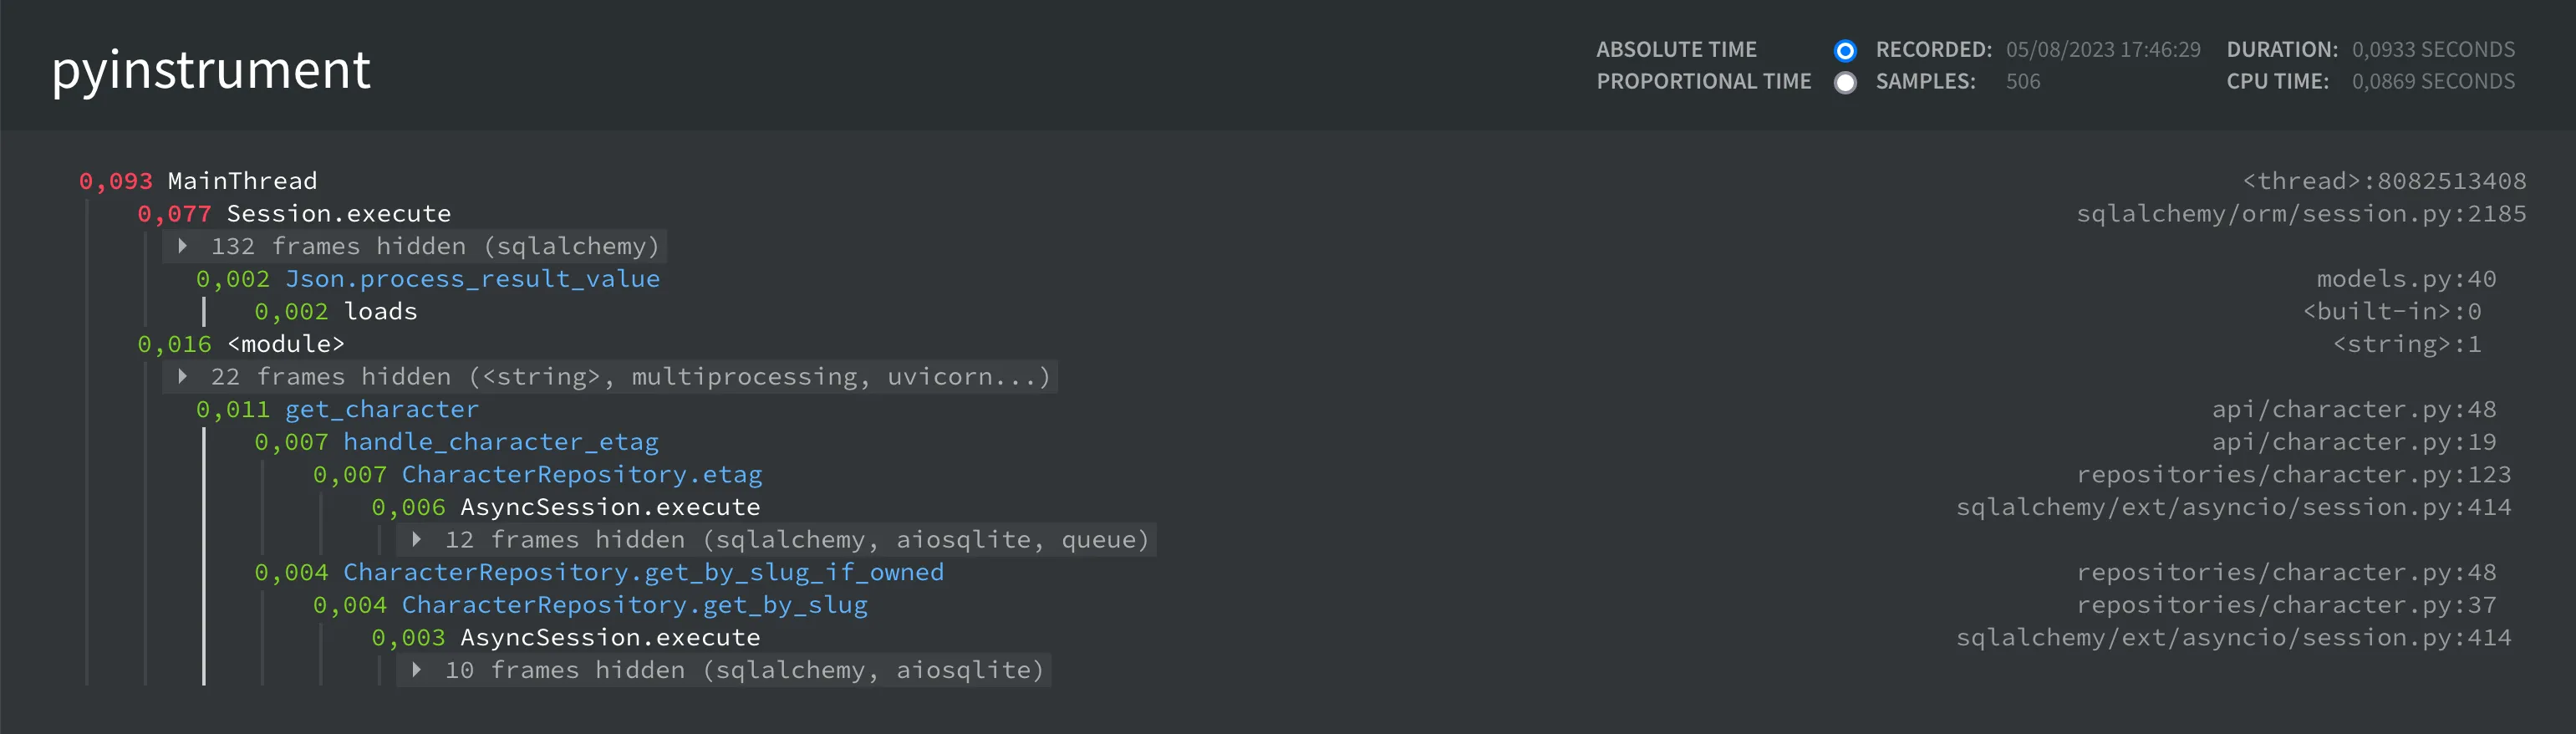
Speedscope profile
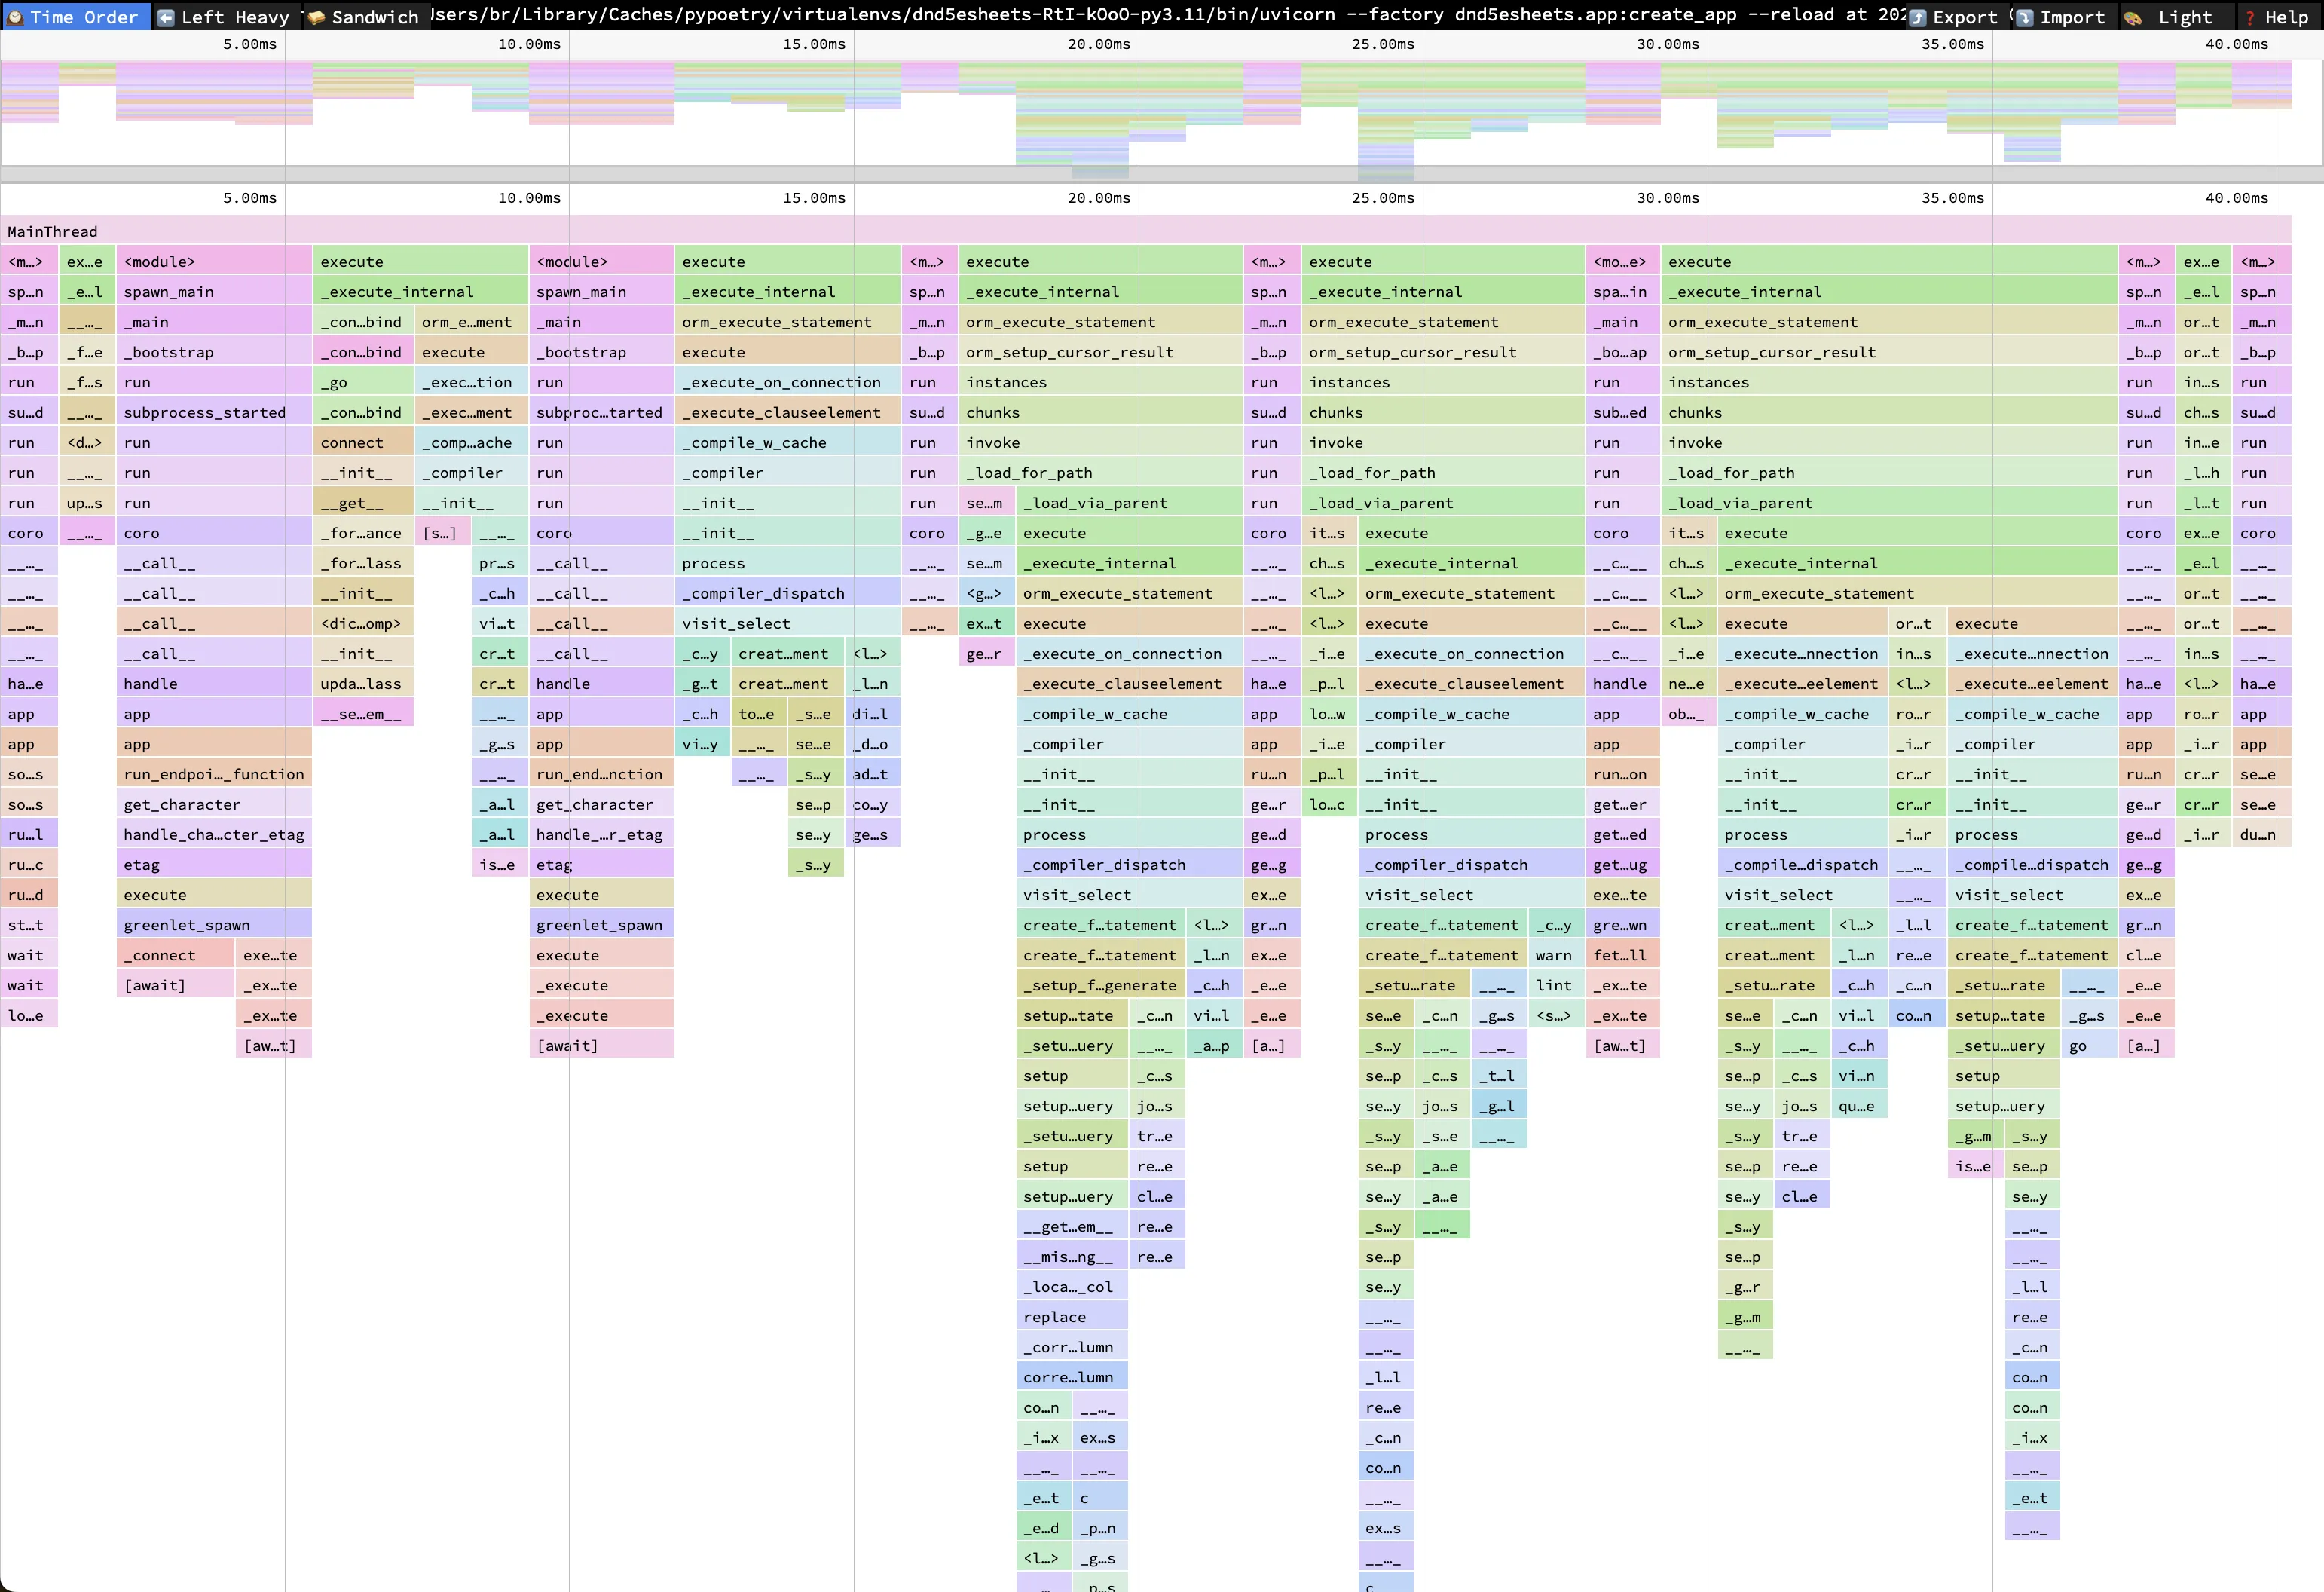
We see pretty clearly the different SQL requests being performed (the execute spans), the different await clauses in the code causing the event loop to pause the execution, and that most of the request time is spent in SQL requests.
Finally, using this setup, I was able to observe the effects of replacing the json stdlib library by orjson when deserializing JSON data from database, and speed up this endpoint by a couple of percent very easily.
Comments